Self-Reported Student Affect


In a previous post, we talked about our State Framework, a feature which enables a student to provide a single data input, in real time, on an ad-hoc basis. In this post, we will be discussing how we are going to use this framework to measure student emotions. In later posts, we will follow up on how we tested what we have built, and on insights that we have found.
While we built the State Framework to be flexible and to allow it to capture any appropriate metric, our goal was always to use it to get some feedback from students on their emotional or affective state. We want to get feedback on a regular basis in real time without interrupting the learning process, and we built the State Framework to allow students to give us exactly that.
But why do we want to capture this? Just because a students’ engagement and outcomes metrics all look good does not mean they are happy with the experience or are confident in their learning. There are multiple studies which demonstrate that a relationship exists between a students’ affective state and their learning outcomes. Knowing what their state is, along with how it changes during the learning process, should allow us to improve our understanding of what is happening with the students, to do a better job of personalizing the learning experience, and to provide students with the right type of assistance at the right time. This is true for both instructors and the adaptive platform itself.
Emotions and affect are complex components of learning. There are many different emotions. Many of these overlap, interact with each other, and can also change rapidly. A person can feel several conflicting emotions at once. To begin with, we can simplify our task by restricting our scope to those that have an impact on learning. Pekrun, Goetz, and Titz (2002) summarize studies involving what they call academic emotions. They list 14 different emotions and examine these in a variety of contexts, including class-related, test-related, and learning-related emotions.
In most cases, the student emotions were measured using a questionnaire. As we want to measure student emotions on a regular basis, we could not use this approach as it would be much too disruptive. Students would spend more time answering the questionnaire than learning! Instead, we turned to the PAD Model of Mehrabian & Russell (e.g. Mehrabian, 1996), along with the work of Bradley & Lang (1994) who developed a graphical means to self-assess affective state. Using their work, which significantly simplifies the task of measuring affective state, we can make some further simplifications to suit our needs and fit within our State Framework model. As with any simplification, we do lose some accuracy, but we feel that our final model is an acceptable compromise between accuracy and ease of use.
PAD Model
The Pleasure-Arousal-Dominance (PAD) emotional state model is a psychological model developed by Albert Mehrabian and James A. Russell (Mehrabian & Russell, 1974a; Mehrabian & Russell, 1974b; Mehrabian, 1996), to describe and measure emotional states. PAD uses three numerical dimensions to represent emotions. These scales can be summarized as follows:
- The Pleasure-Displeasure Scale measures how pleasant or unpleasant one feels about something.
- The Arousal-Nonarousal Scale measures how energized one feels. It is not the intensity of the emotion.
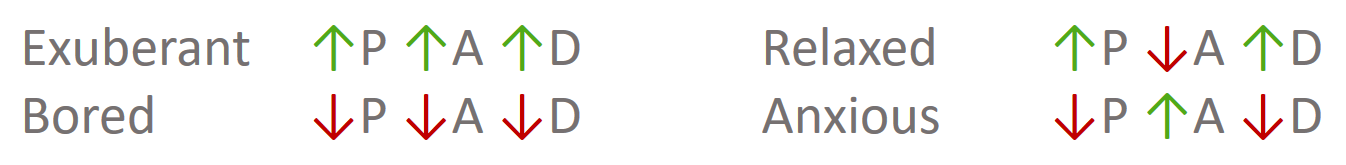
- The Dominance-Submissiveness Scale represents how controlling and dominant versus controlled or submissive one feels. For instance, while both fear and anger are unpleasant emotions, anger is a dominant emotion, while fear is a submissive emotion. All emotions can be mapped onto some point in this three-dimensional space. For example, Exuberance would be high on all 3 scales and Bored would be the opposite.
This vastly simplifies things for us. Rather than considering the wide range of possible emotions we just need to consider a reduced set of scales.
Manikin Based Scales
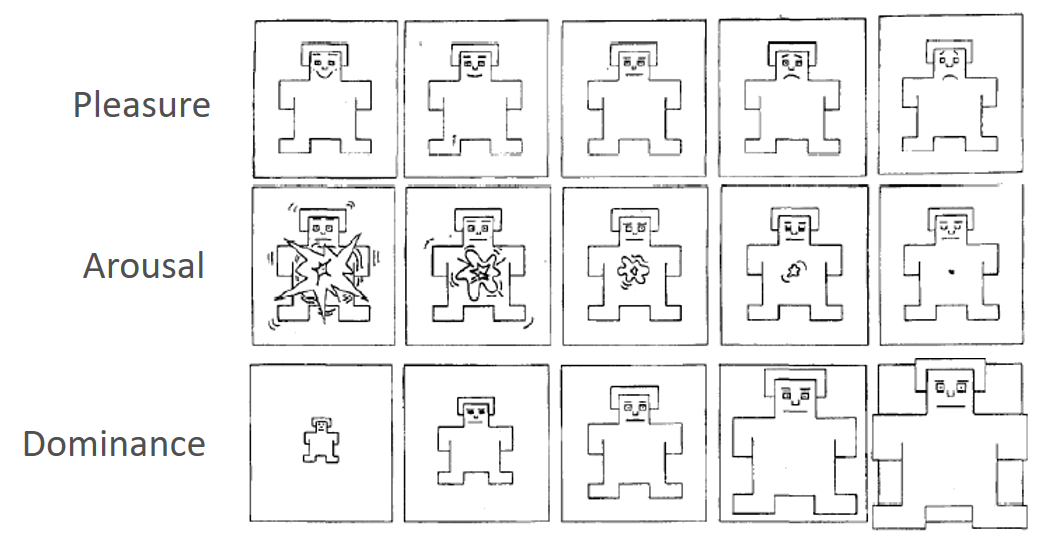
But how do we measure where a student falls on each of these three scales? Well, we ask them! Asking someone where they fall on the three scales in PAD model will only be accurate if they have an objective understanding of each scale. What value would you assign on the P-scale if you are feeling happy? Would everyone assign the same value to the same feeling? Here is where the work of Bradley and Lang comes into play. These authors break each scale into 5 points and use a figure they refer to as a manikin to suggest to the respondent the feeling that corresponds to that point on the scale (Lang, 1980; Bradley & Lang, 1994). Respondents then pick the manikin on each scale that best represents their current emotional or affective state.
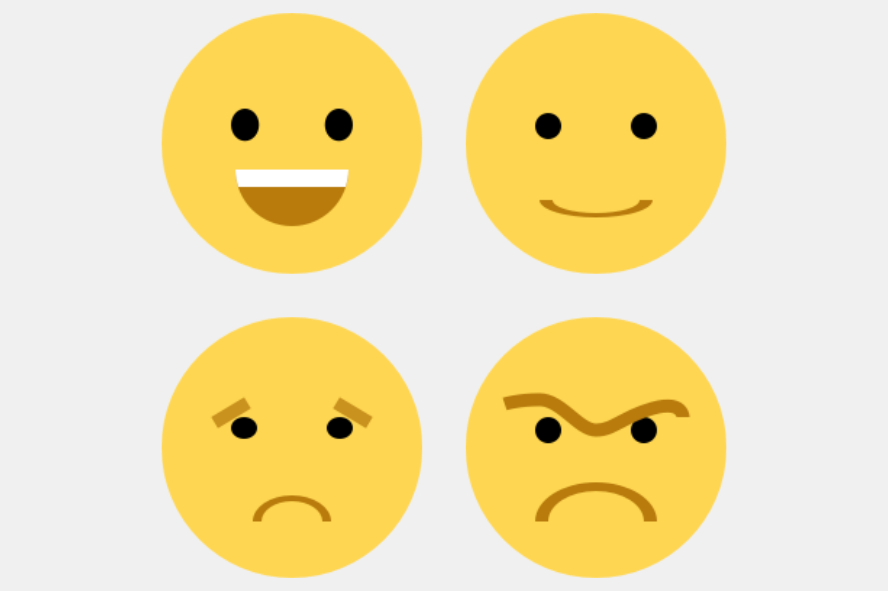
We will follow this general approach, but with some simplifications. First, as others have done, we will concentrate on what are termed the “core affect” dimensions, dropping the dominance scale (e.g. Russell, 2003). We also reduce the number of points on each scale to two. This simplification results in two points on each scale or a choice between four possible positions. Instead of using Bradley and Lang’s manikins, we modernized them to something with which people would be a bit more familiar. We created an emoji for each possible position, which we felt represented the best intersection of the two scales at that point. We also associated a description with each emoji which we felt accurately reflected the position.
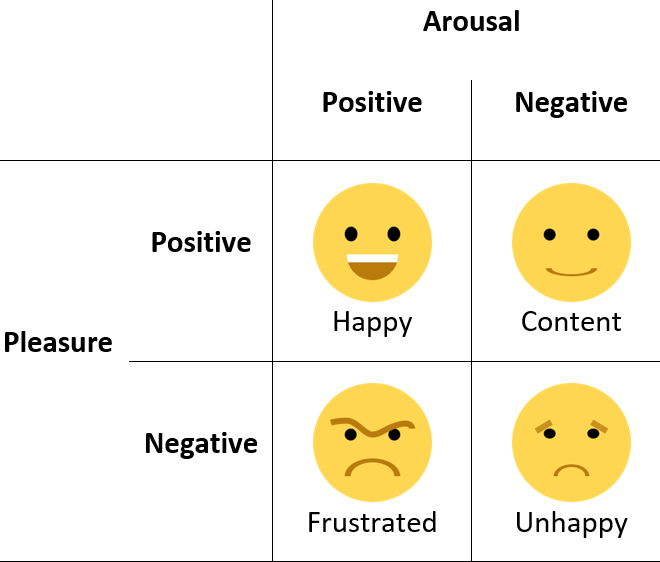
To give us feedback on their affective state, students need to pick just one of four possible positions. However, there are many unanswered questions. Is this too simplistic? Given the full range of emotions, if a student can only pick one of the four above, how do we know what other emotions we are capturing in this category? Would we not be better off with more categories? Did we choose the right faces and make them accurately reflect the different points on the two scales? Did we choose the correct descriptions?
We have a lot of questions to answer. Some we couldn’t address until we deployed the feature so that we could start to collect data and feedback. Others we could (and did) test up front - we will discuss these in upcoming posts.
Wrap Up
This model is our first step towards listening to the student voice, and not just measuring learning. We still don’t know what this data is going to tell us, or how the instructors, mentors, or the platform itself should use and interpret it. Answering the questions we have raised will be one of the ongoing research projects that we will collaborate on with some of our partner institutions. We are always interested in any feedback anyone has, so please send us a message if you have any advice, words of warning, or if you are interested in collaborating with us on this.
References
- Bradley, M., & Lang, P. J. (1994, March). Measuring emotion: the Self-Assessment Manikin and the Semantic Differential. Journal of Behavior Therapy and Experimental Psychiatry, 25(1), 49-59.
- Lang, P. J. (1980). Behavioral Treatment and Bio-behavioral Assessment: Computer Applications. Technology in mental health care delivery systems, (pp. 119-137).
- Mehrabian, A. (1996, December). Pleasure-arousal-dominance: A general framework for describing and measuring individual differences in Temperament. Current Psychology, 14(4), 261-292.
- Mehrabian, A., & Russell, J.A. (1974a). An approach to environmental psychology. Cambridge, MA: M.I.T. Press.
- Mehrabian, A., & Russell, J.A. (1974b). A verbal measure of information rate for studies in environmental psychology. Environment and Behavior, 6, 233-252.
- Pekrun, R., Goetz, T., & Titz, W. (2002). Academic Emotions in Student’s Self-Regulated Learning and Achievement: A Program of Qualitative and Quantitative Research. Educational Psychologist, 37(2), 91-106.
- Russell, J. A. (2003). Core affect and the psychological construction of emotion. Psychological Review, 110(1), 145-172. http://dx.doi.org/10.1037/0033-295X.110.1.145