Adaptive Analytics: CTU - a Time Critical Setting for Predictive Modeling


This is the second blog post summarizing results from a collaboration with the University of Central Florida and Colorado Technical University on building models that can predict student success at the course level for College Algebra. You can access the first summary blog post here and read the full set of results in the following article:
In this blog post, we examine the impact of building a sequence of predictive models corresponding to different time slices within a course. We look at questions such as how early in the course you can get reliable models and what are the most important indicators for student success at various time points. For this section, we use data from Colorado Technical University (CTU). This proves to be a particularly tough test bed for building and deploying time-sensitive models as their courses are just 5.5 weeks long, limiting the amount of time to gather data and for educators to act on any predictions.
The Goal
The University of Central Florida (UCF) data suggested an approach to predictive modeling that provides learners with concrete and learnable actions that positively impact their odds of success. While a UCF course typically lasts 16 weeks, a CTU course lasts just 5.5 weeks. The short length of the terms at CTU produces a much more challenging environment for any predictive model. In this section of the study, we explored the impact of time on predictive models’ effectiveness. In particular, we sought to answer two questions:
- How long does it take to collect data to build a reliable predictive model?
- What are the most important metrics when making a prediction, and do they change over time?
The Data
For this analysis, data were gathered from over 5,000 students across seven terms in a math course at CTU. The metrics used are slightly different from those used in the UCF analysis; however, they are all derived from the data implicitly collected by the Realizeit adaptive learning platform. There are eight metrics used in this study and they capture: the level of engagement (e.g., total time, number of activities), the breadth of engagement (e.g., number of objectives attempted), and level of knowledge (e.g., number of concepts complete). Please reference our article for more details.
The Model
To bring time into the model, we built a sequence of models (classification trees) corresponding to weekly time slices. So the first model would use week 1 data to make its predictions, the second model would use data from week 1 and 2 to make its predictions, and so on. So the overall model contains one “sub-model” (classification tree) for each week of the course.
Enough Data
Using the most common outcome from the previous version of the course, we can construct a baseline model. This model predicts everyone passes or everyone fails, depending on which is the most common outcome.
“If a course has very high or very low success rates, then this baseline model can be accurate. However, it may not be a particularly informative model because it does not provide insights into why students are successful or not.”
We compare our model’s accuracy to this baseline model for each week of the course on unseen data. Because we use classification trees, if our model does not have enough data, it will revert to the simple baseline model. Only when the data contains some signal that can help the model distinguish between the successful and unsuccessful students will it begin to beat the baseline. We can see when this happens in the CTU Math data by examining the chart below. It shows the accuracy ratio of the two models - values higher than one shows that our model is beating the baseline.
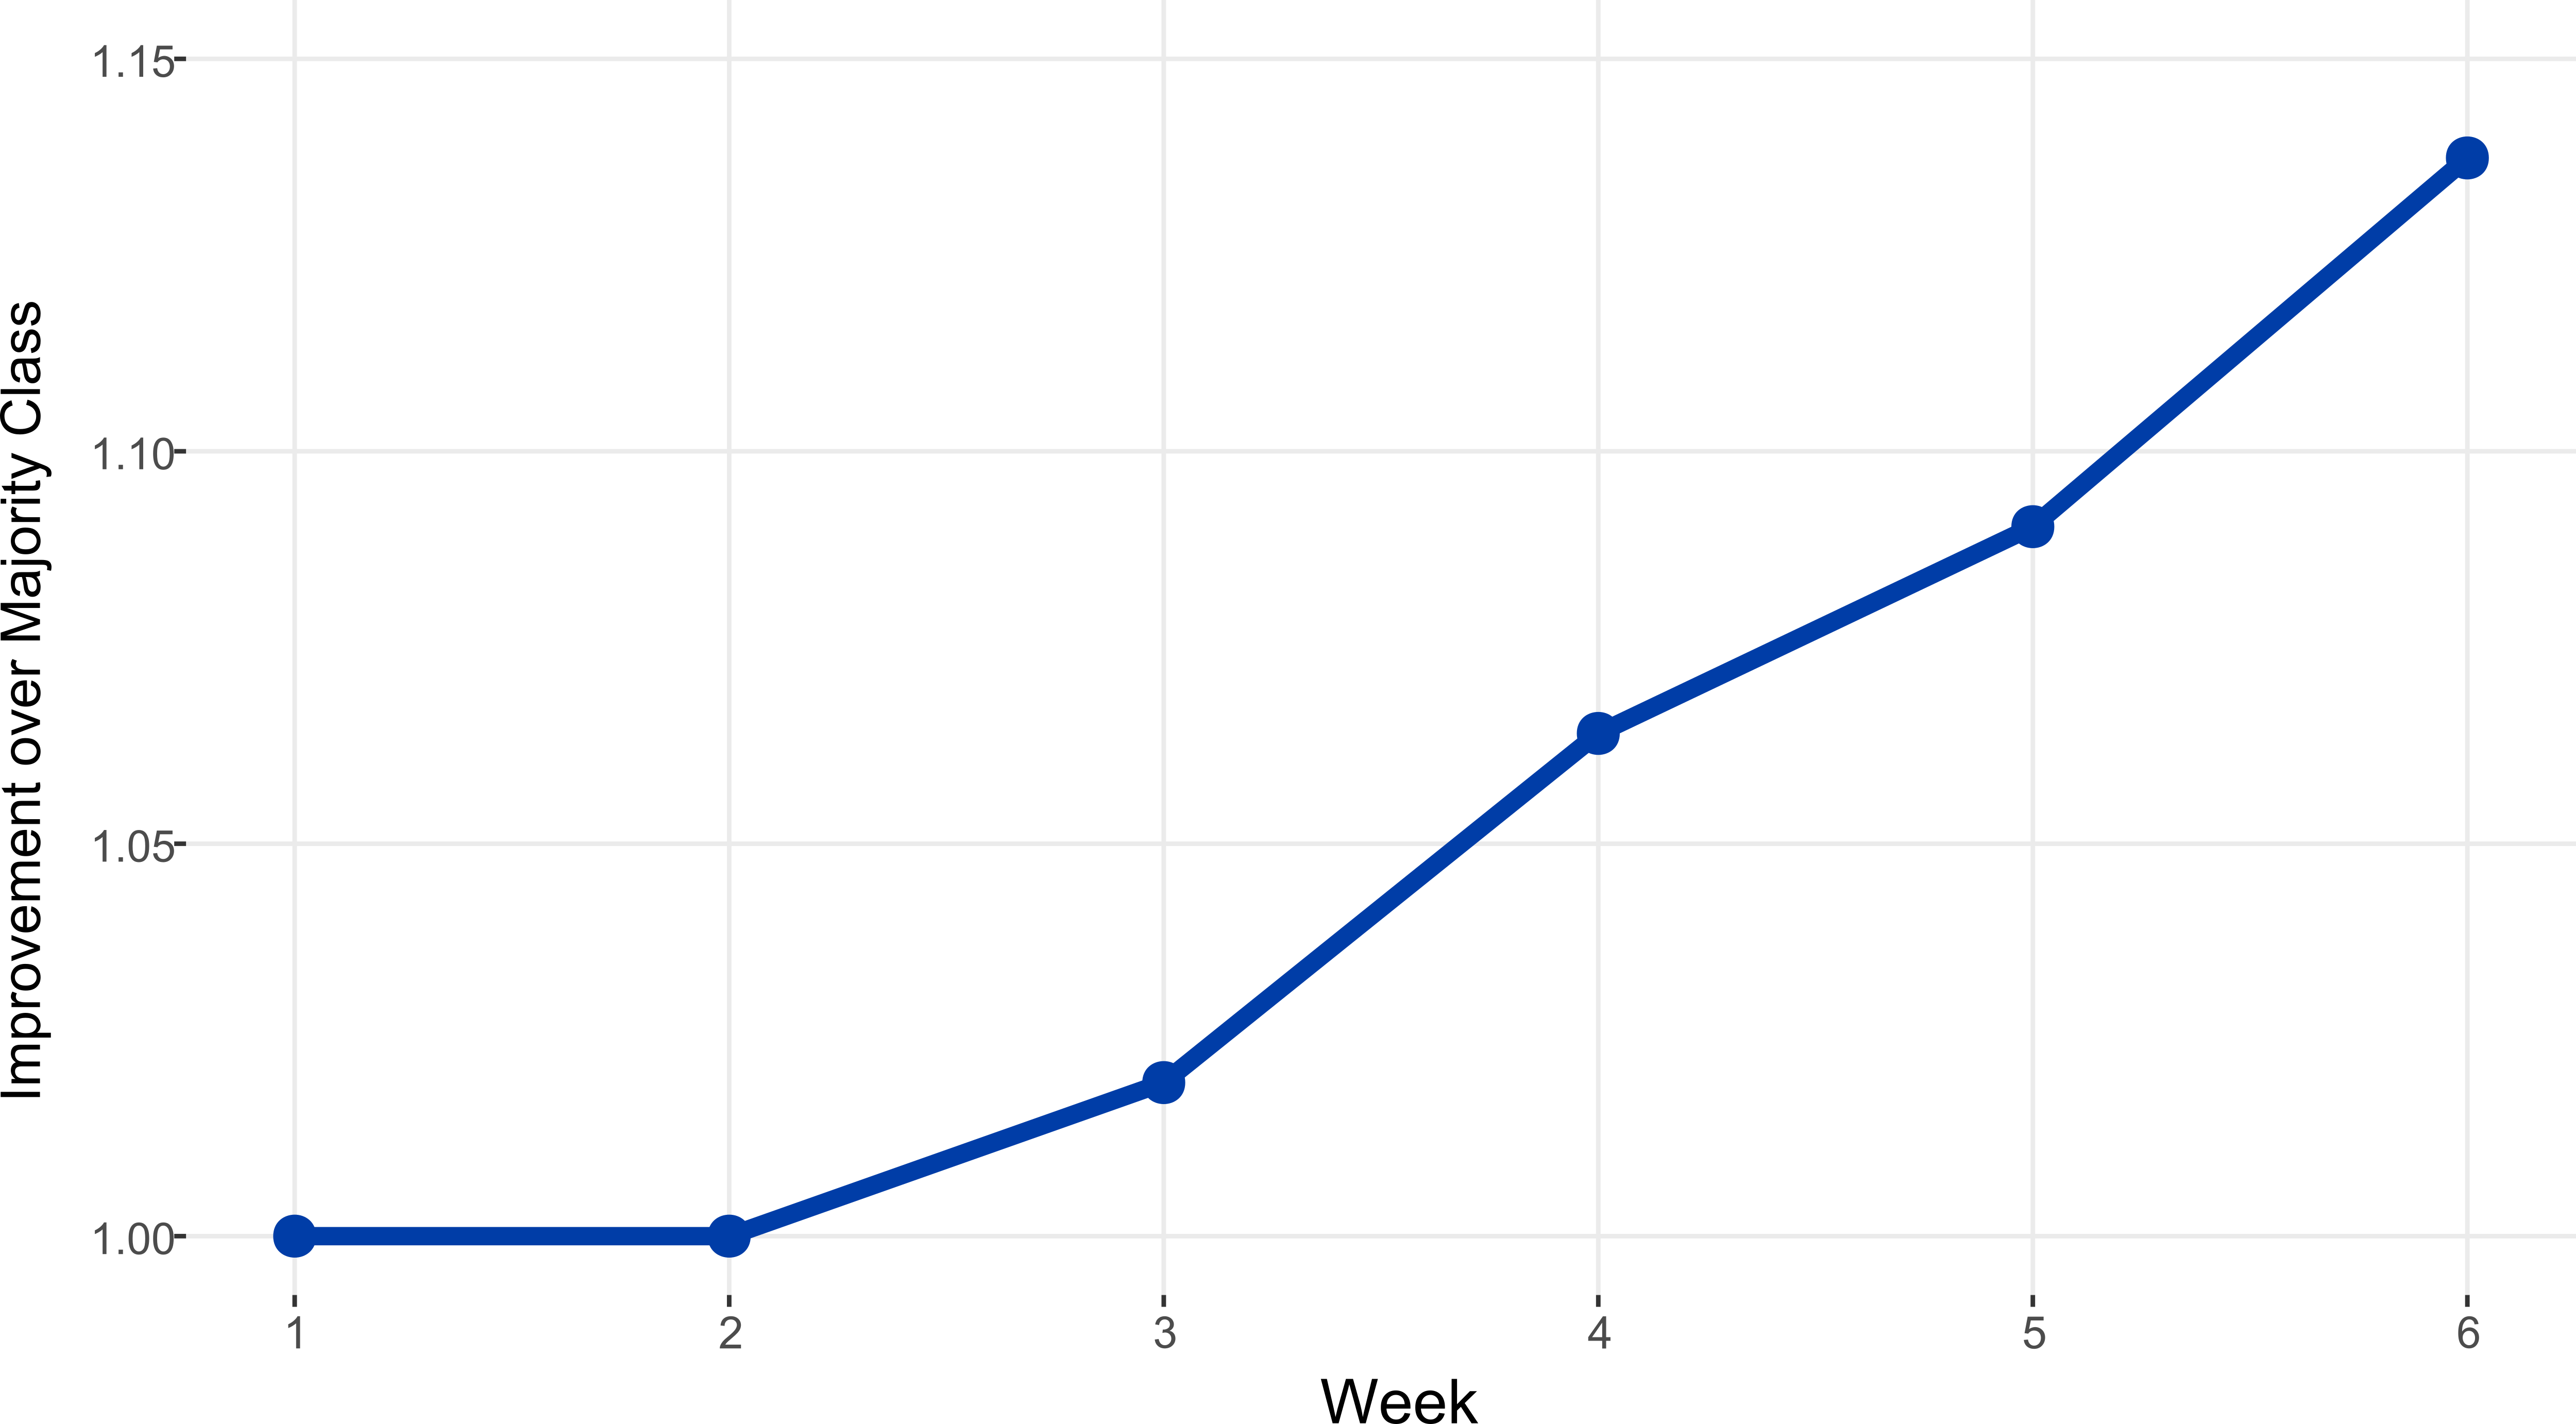
We can see that not until week three is there enough signal in the data to beat the baseline. This has some consequences for rolling out early warning type models in time-constrained courses.
“Requiring three weeks of data poses a considerable challenge in the CTU context because it leaves just two and a half weeks before course completion to intervene with students predicted to be unsuccessful. This three-week requirement of data is also present in the UCF context; however, with 16-week courses, there is usually sufficient time to intervene.”
Variable Importance
Predictor Importance (for more details, see the paper) allows us to measure how important an individual variable is to each weekly sub-model. This metric tells us which variables are contributing the most signal to the predictions. Importance ranking is used rather than raw importance scores to simplify our analysis, with the variables ranked from most to least important. The chart below shows the change in rank over time.
![]()
There are several noteworthy outcomes:
- Seat-time measures (start day, number of active days) remain unimportant across all models/time slices. They contain little or no signal for course success.
- Measures that capture the quantity of engagement (total time, number of activities) start out as important, but decrease in rank over time.
- Measures that capture the quality and breadth of engagement (number of nodes attempted, number of nodes completed, mean knowledge covered) increase in importance.
The key take-away for an educator is that
“… the variables that need to be monitored change as the course progresses. Metrics related to the traditional seat-time view were not predictive of student success. While at the beginning of the course, it is important to monitor effort levels, as the course progresses, it becomes more important to monitor the quality of the engagement and the level of progress of students.”
Impact
The model described above follows the general architecture of the predictive models used in Realizeit. While rolling out these models, we encountered several challenges that we thought would be worth sharing. These include
- Predictions can quickly become out of date - With predictions made once a week, they can quickly become irrelevant as the student makes progress. This could lead to making decisions based on outdated information.
- Counter-intuitive predictions - Some predictions can appear counter-intuitive when solely examining outcome metrics, as the model also takes behavior into account. For example, two students may have the same number of concepts covered and to the same standard, but one may have engaged in much more revision and practice increasing their chance of success.
- Guidance instead of probabilities - Research shows that people are generally not good at interpreting probabilities. They can assume that a high probability guarantees success, while a low probability implies certain failure. They can also struggle with knowing what to do to increase the probability of success - what is their best strategy going forward? To avoid these problems, we need models to move towards providing actual guidance, not just numbers.
Work is already on the way to tackle each of these challenges, and we are eager to share what we learn.
Next Up
If you haven’t yet, read our summary of the first part of this study, which discusses the work carried out by the University of Central Florid, where they explored building models based on variables that capture teachable skills.
If you found the research article or summary blog posts interesting, please share them with your colleagues!